Addis Ababa - Simple
About Examples
The evpv_examples repository provides a collection of ready-to-use case studies, complete with all necessary input and configuration files. These examples can help you explore the capabilities of the EV-PV simulator and serve as blueprints for developing your own custom analyses. Each example includes all the required files to run it. When applicable, examples are provided with both a configuration file for execution in basic mode (using the command-line interface), and a Python run script for execution in advanced mode for more control.
Note
To run one of the cases, first DOWNLOAD the repository containing the examples, extract it and copy the contents of the example folder into the directory of your choice.
The following examples are available:
AddisAbaba_Simple: A simple yet complete case study on the city of Addis Ababa, showcasing the full set of core outputs (mobility demand, charging demand, and EV-PV complementarity).
Overview of the AddisAbaba_Simple example
This example case study simulates mobility demand, EV charging demand, and EV–PV synergy indicators in the administrative region of Addis Ababa. It models a simplified scenario that includes a basic EV fleet, user charging behavior at home, workplaces, and points of interest (POIs), and solar PV generation.
The example includes: (1) A configuration file for basic usage (2) A Python run script for advanced usage (3) a folder with the required input data (4) an empty folder where the results will be stored.
This document focuses on descrtibing the inputs and results obtained with the configuration file. However, note that all parameters can also be specified using the Python script (see script documentation directly for details).
Inputs
The configuration file is divided into several sections, each representing a key aspect of the simulation. Users are encouraged to explore the file directly for full documentation of available options. The default values define a simplified EV charging scenario for Addis Ababa:
General Settings: Output path and a name for the scenario.
EV Fleet Properties: Define the number of EVs to simulate and their properties, including battery size and energy consumption per km.
Region of Interest: Set the path to geospatial files defining the region of interest boundaries (GeoJSON) and features (population, workplaces, POIs). Also, set the spatial resolution.
Mobility Simulation: Configure parameters regarding the mobility demand simulation (e.g., with or without routing APIs)
Charging Scenario: Define the charging scenario: share of people charging at the different location types (home, work, POIs), available charger powers, typical arrival times at home and work.
PV Energy Production: Set the PV system type (rooftop, groundmounted, …), as well as the simulation year.
EV-PV Complementarity: Define the PV capacity and the time frame for extracting the EV-PV complementarity indicators.
Advanced Parameters: Fine-tune the analysis with details such as traffic zone creation, trip distribution models, and technical parameters for PV.
Outputs
After running the simulation, results are saved in structured subfolders inside the specified output directory. These outputs include raw data (CSV), and some interactive visualizations maps (HTML). A log file is also included for troubleshooting.
Folder structure and contents
Folder |
File |
Description |
|---|---|---|
|
mobility_res_TripDistribution_flows.csv |
Origin–destination matrix of vehicle flows between zones, including road and Euclidean distances. |
mobility_res_TripDistribution_aggregated_zone_metrics.csv |
Zone-level stats: total incoming/outgoing trips, total and average travel distances per vehicle. |
|
mobility_vis_Region.html |
Interactive map showing zone features such as population, POIs, and workplaces. |
|
mobility_vis_VehicleAllocation.html |
Map of vehicle allocation per zone, based on origin points. |
|
|
charging_res_temporal_demand_profile.csv |
Time series of raw charging power for each vehicle on the days it charges. |
charging_res_temporal_demand_vehicle_properties.csv |
Vehicle metadata: charging frequency, location, arrival/departure times; cross-referenced by vehicle ID. |
|
charging_res_temporal_demand_aggregated.csv |
Aggregated charging curves by location type, showing total power, vehicles present, and vehicles charging. |
|
charging_res_spatial_demand.csv |
Daily charging demand by zone: total energy and number of charging vehicles. |
|
charging_vis_TotalDemand.html |
Interactive map of total daily charging demand per zone. |
|
charging_vis_DemandPerVehicle.html |
Map of average energy demand per charging vehicle per zone. |
|
charging_vis_NumberVehiclesCharging.html |
Map showing number of vehicles attempting to charge per zone. |
|
|
evpv_res_PVProduction.csv |
Hourly PV energy production with performance metrics such as performance ratio and capacity factor. |
evpv_res_DailyIndicators.csv |
Daily EV–PV synergy indicators: self-sufficiency, self-consumption, and excess PV energy. |
Examples visualization
Data is saved in CSV format for compatibility with your preferred program (e.g., Excel, Python, R, etc.) for analysis and graphing. Some results are also readily available as HTML folium maps. The graphs below show some HTML maps and plots created from the raw results for demonstration purposes.
Mobility Demand: Results of the vehicle allocation process and distribution of travel distance by road between the traffic zones.

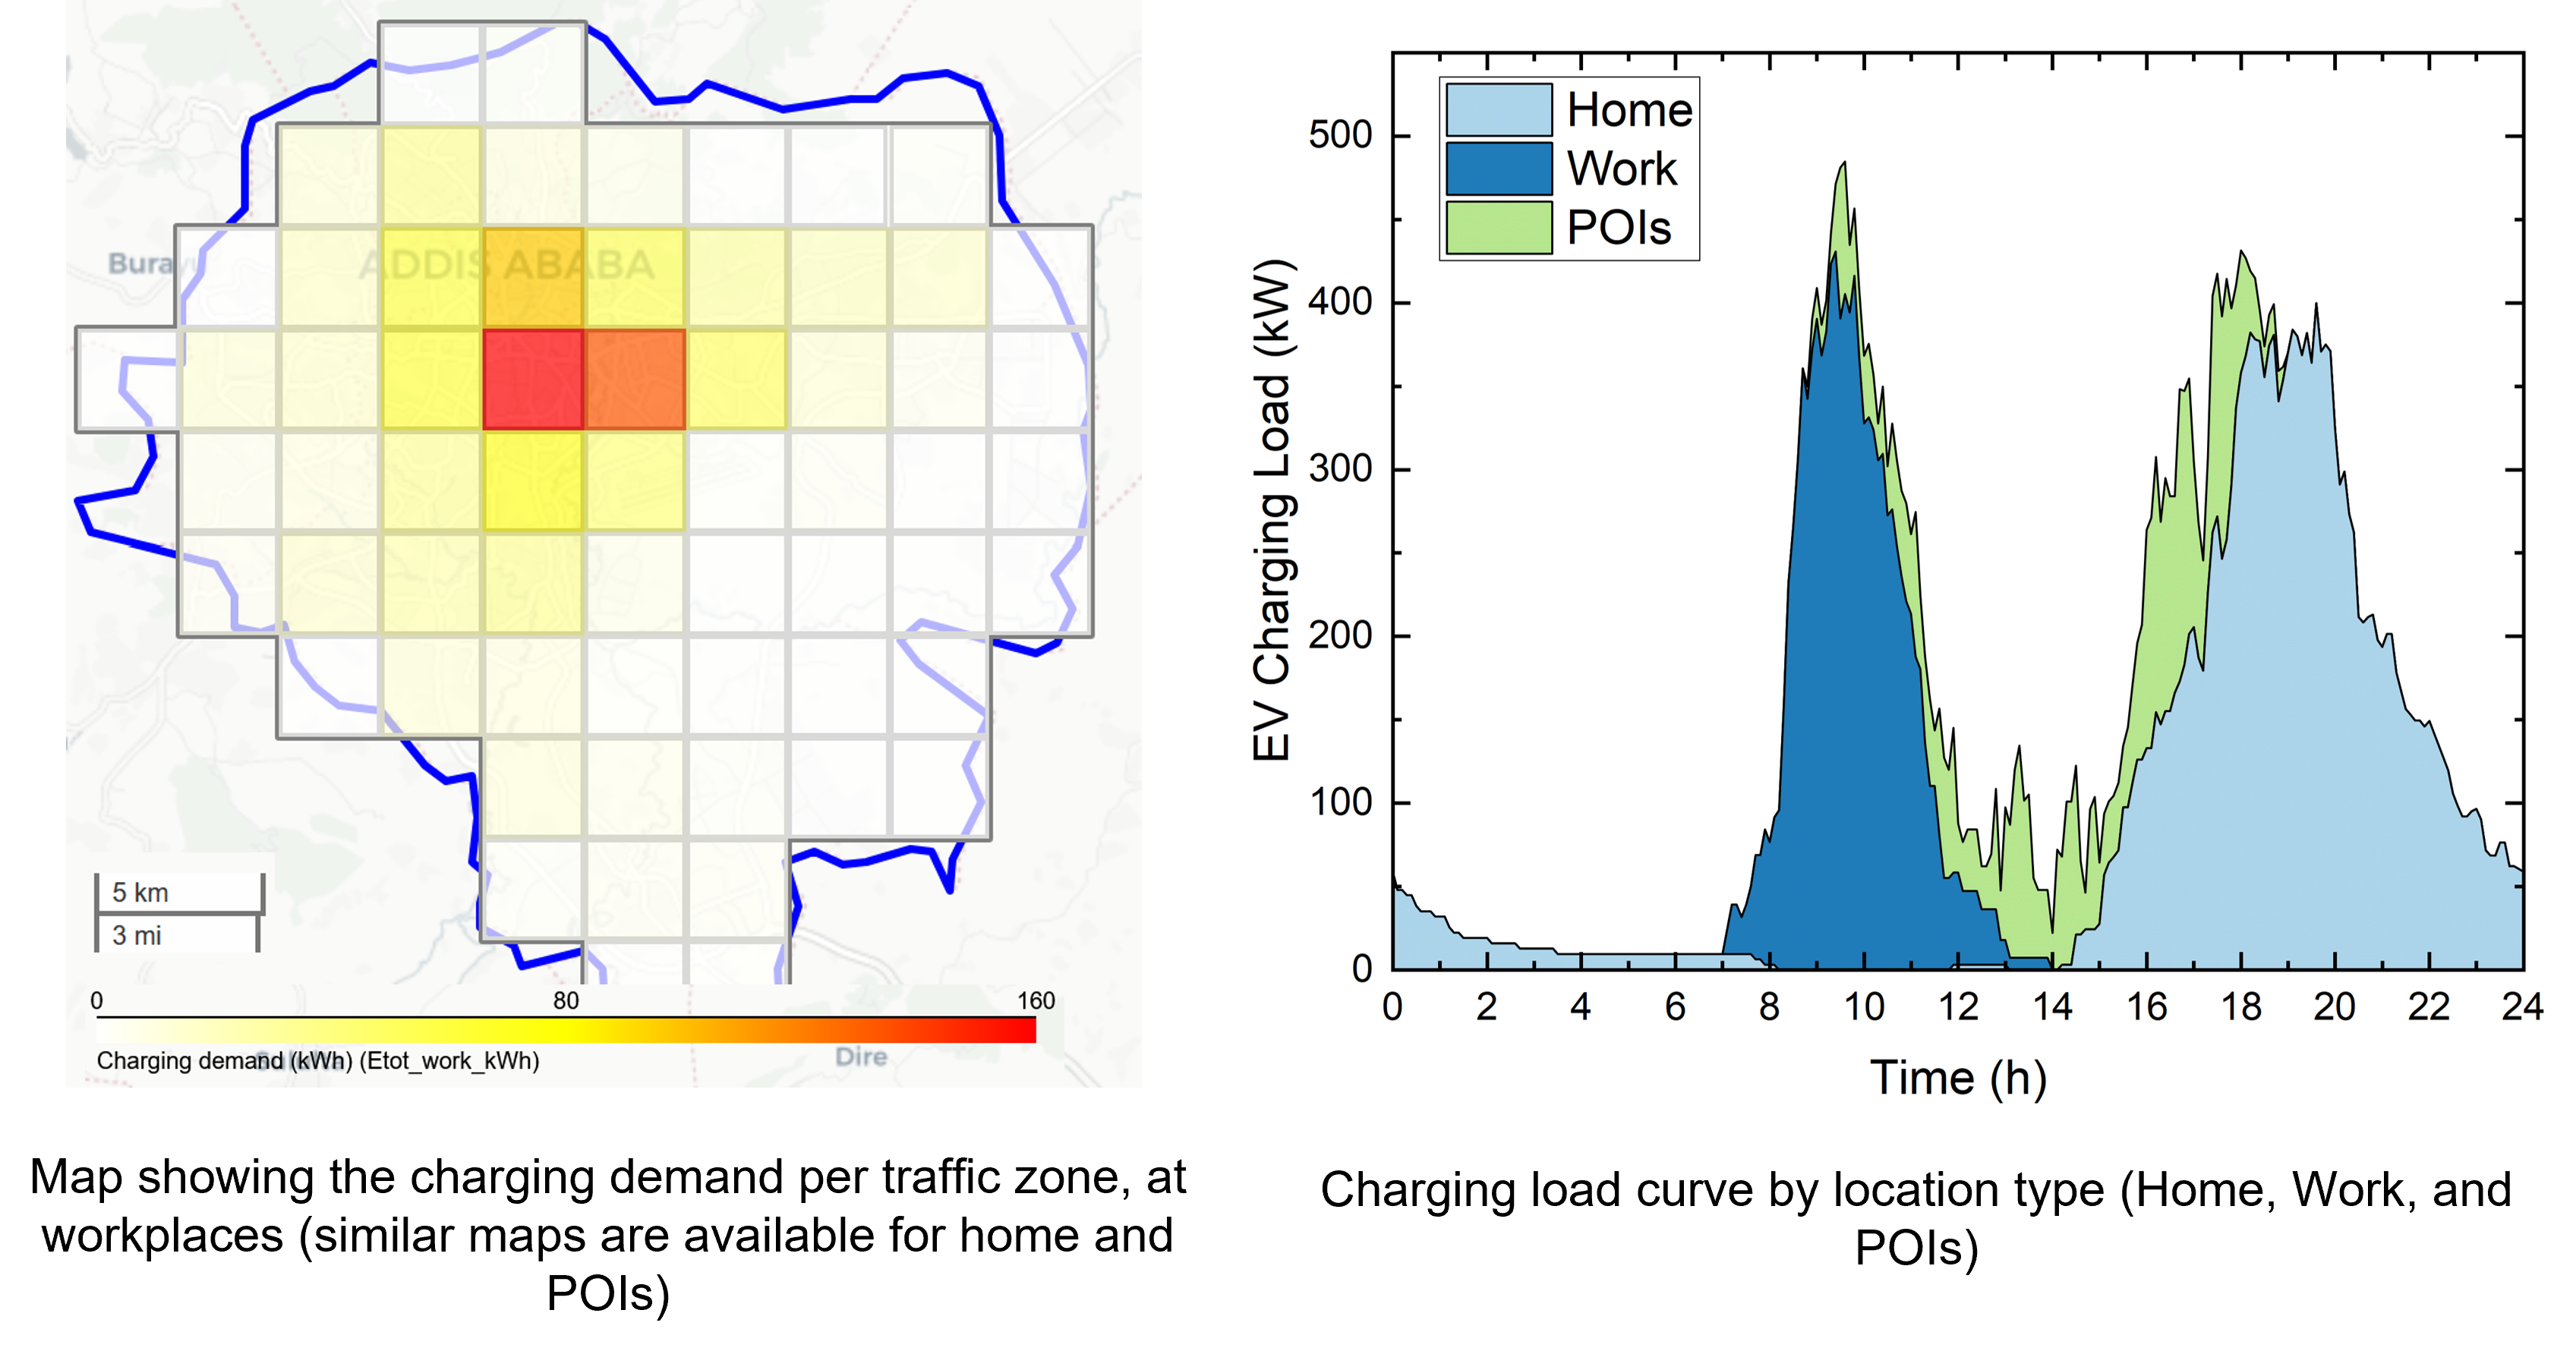
Charging Demand: Map of the charging demand at workplaces and (aggregated) EV charging load curve at home, work, and POIs.
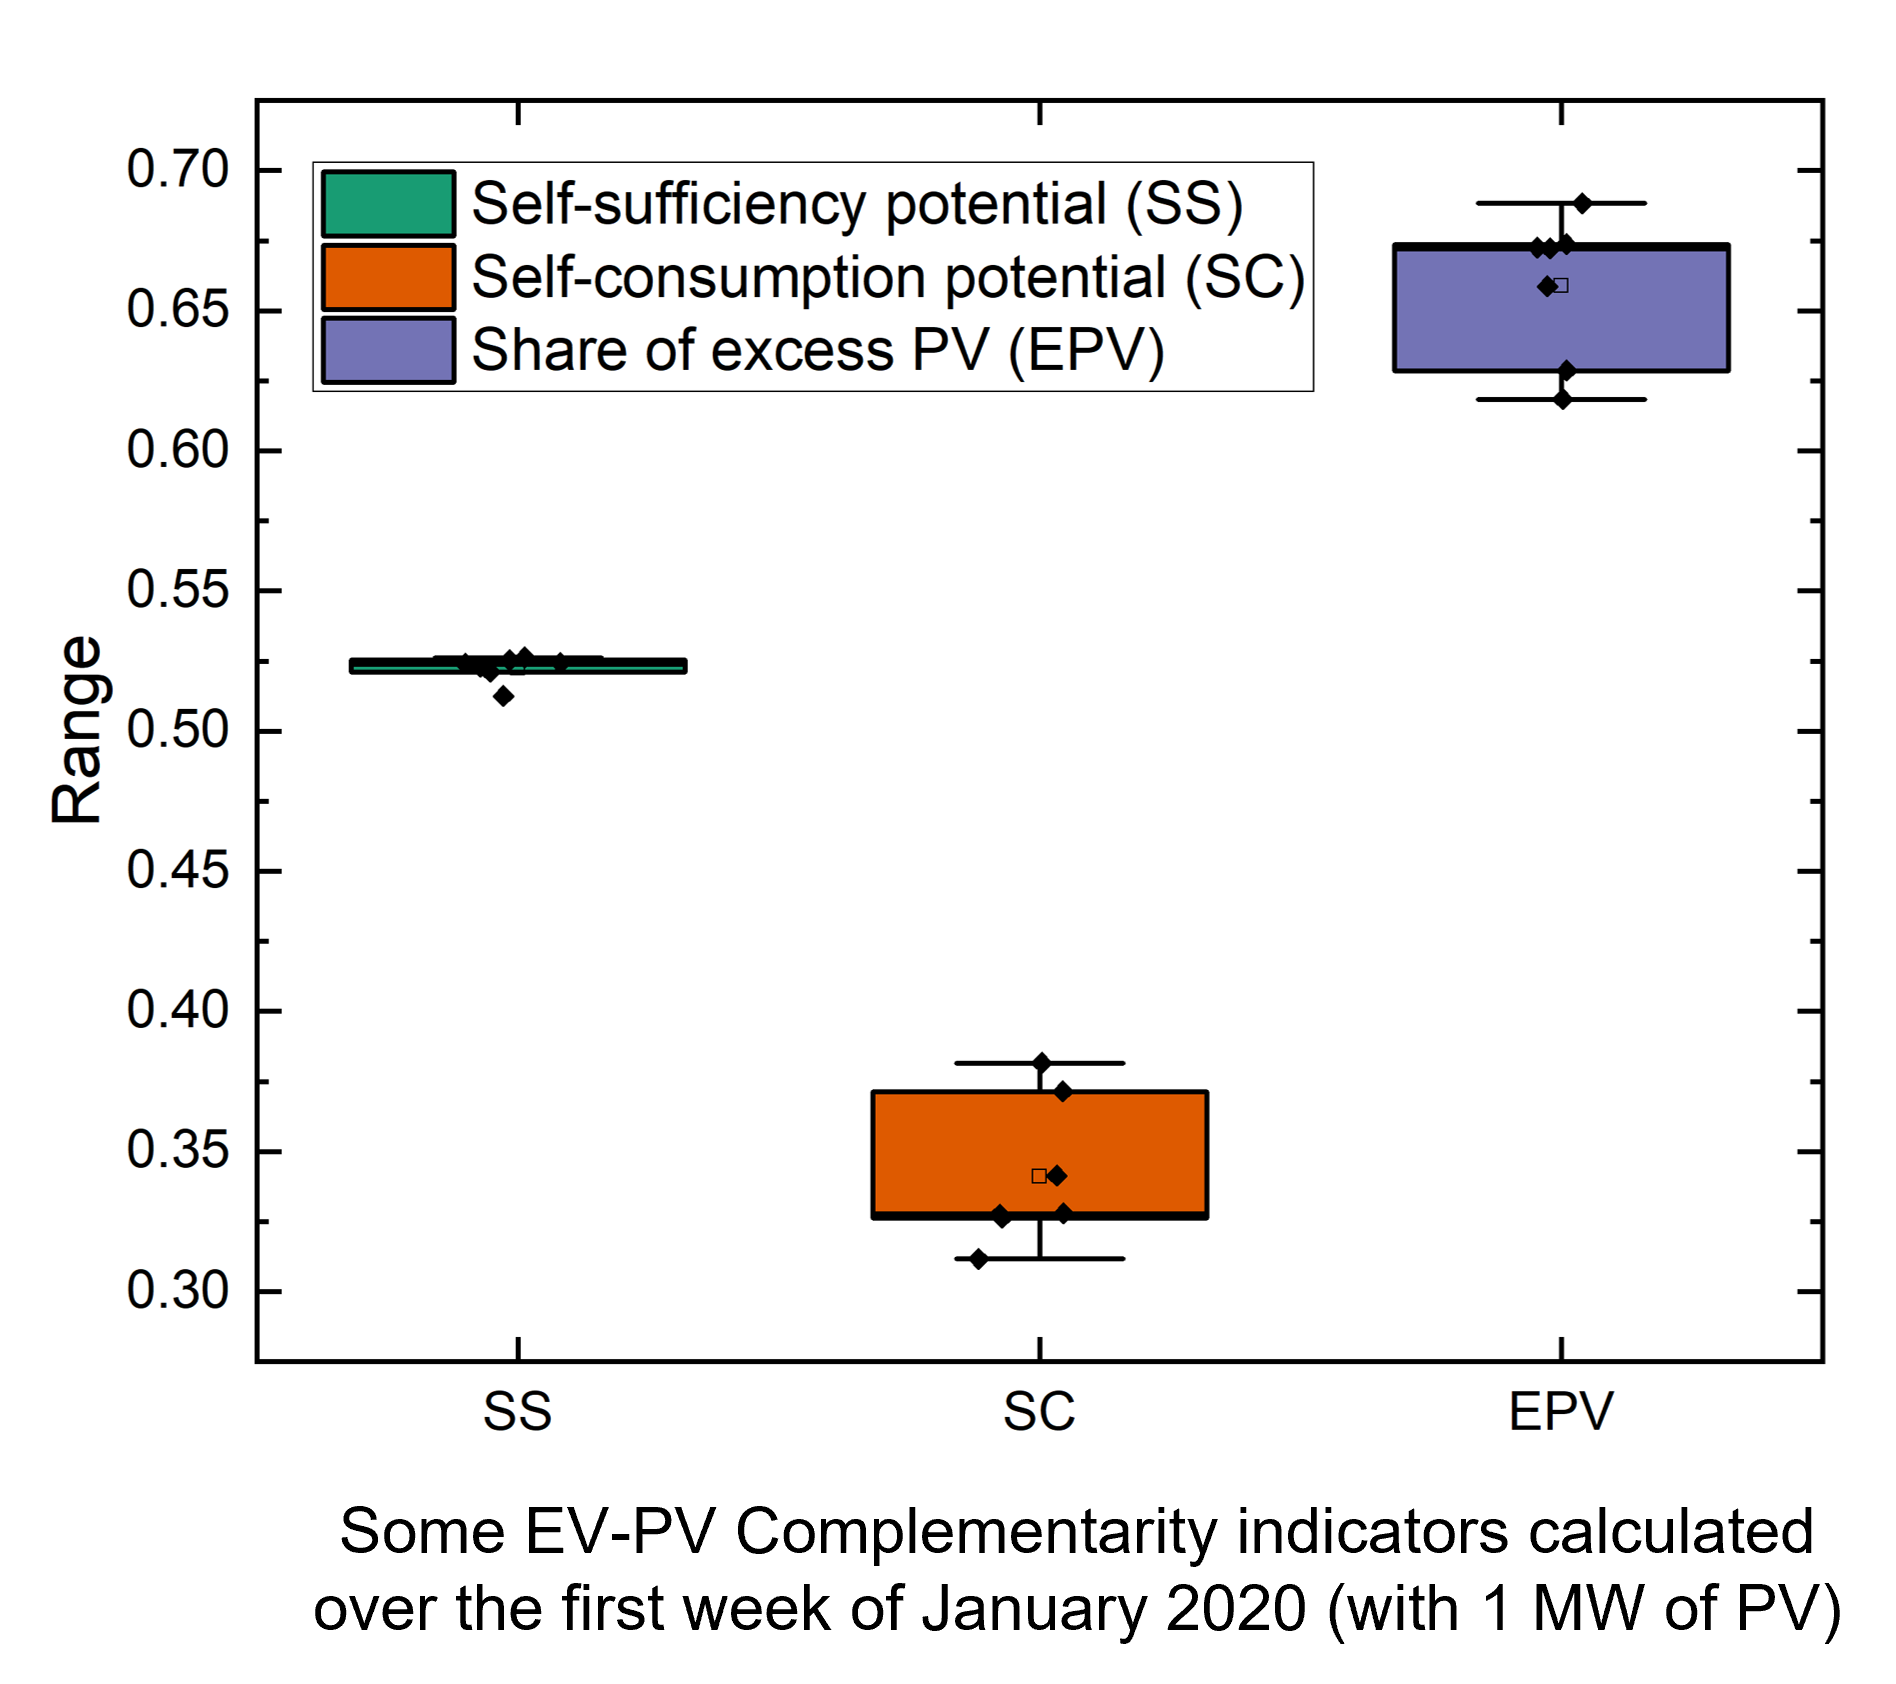
EV-PV Complementarity: Some complementarity indicators calculated for 7 days.